After previous increases, Bitcoin (BTC) and the Crypto Market Cap (TOTALCAP) fell yesterday. Klaytn (KLAY) has nearly returned to long-term support.
In the news today:
TOTALCAP Trades Above Support
The cryptocurrency market cap has increased inside an ascending parallel channel since the start of 2023. The upward movement caused a breakout in December 2023. It led to a high of $1.73 trillion on January 2.
While the high was made above the 0.382 Fib retracement resistance level and the horizontal resistance area at $1.61 trillion, TOTALCAP failed to close above this level. Rather, it created a bearish candlestick the next day.
Despite the decrease, TOTALCAP validated the resistance line of the previous ascending parallel channel (green icon). It increased again on January 8, moving above the resistance area. If the upward movement continues, TOTALCAP can increase by 26% and reach the $2.10 trillion resistance area.
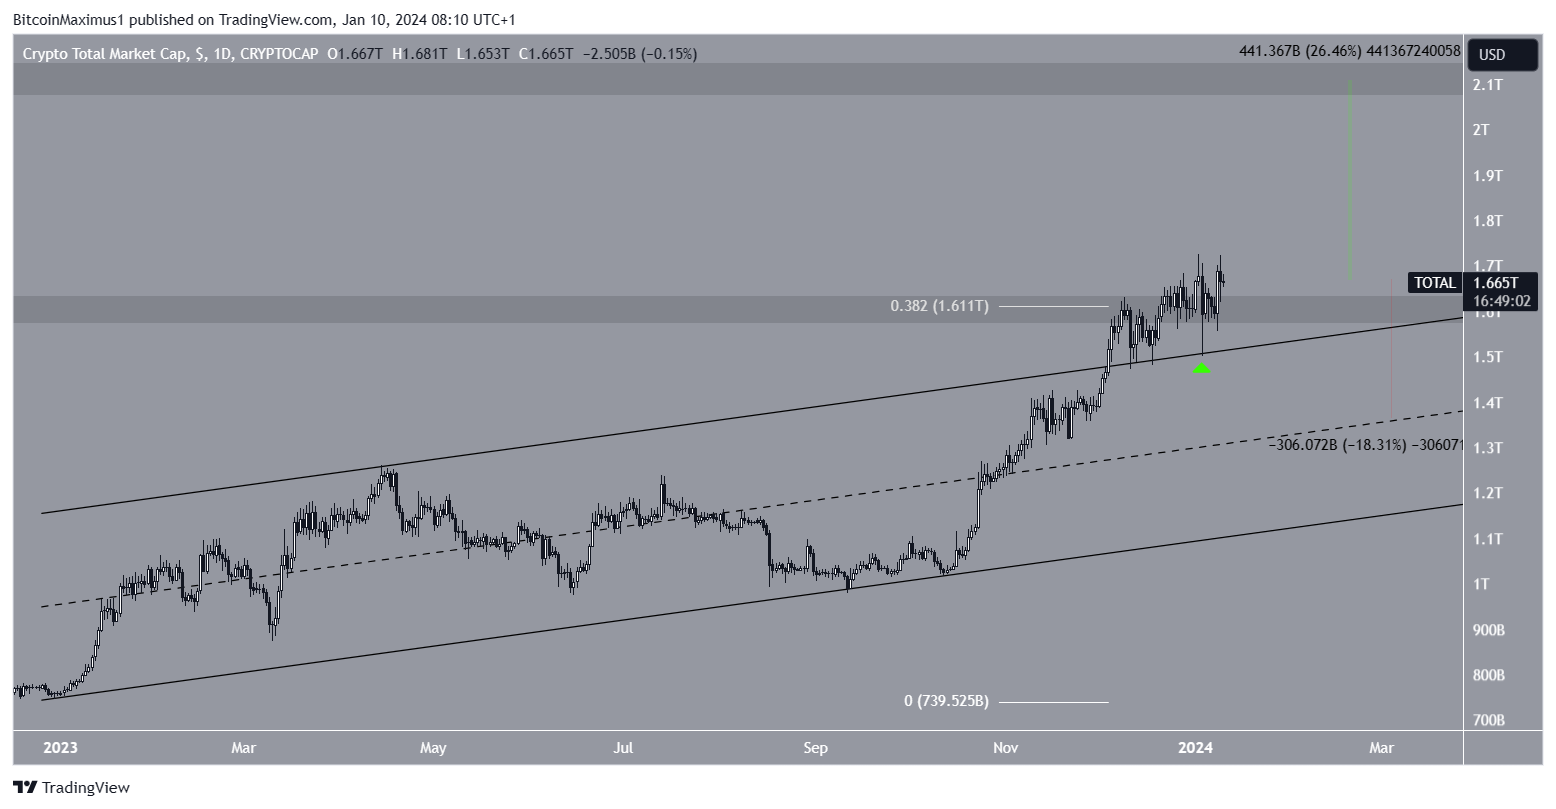
Despite the bullish TOTALCAP prediction, a close below the $1.61 trillion area can trigger an 18% drop to the channel’s midline at $1.35 trillion.
Bitcoin Does Not Sustain Breakout
The BTC price has increased swiftly since September 2023. The increase led to a breakout above the 0.5 Fib retracement resistance level at $42,300. This is also a horizontal resistance area. The upward movement led to a high of $47,897 yesterday before the BTC price fell slightly.
Currently, BTC trades above an ascending trend line, acting as support. Whether the BTC price bounces or breaks down can determine the future trend.
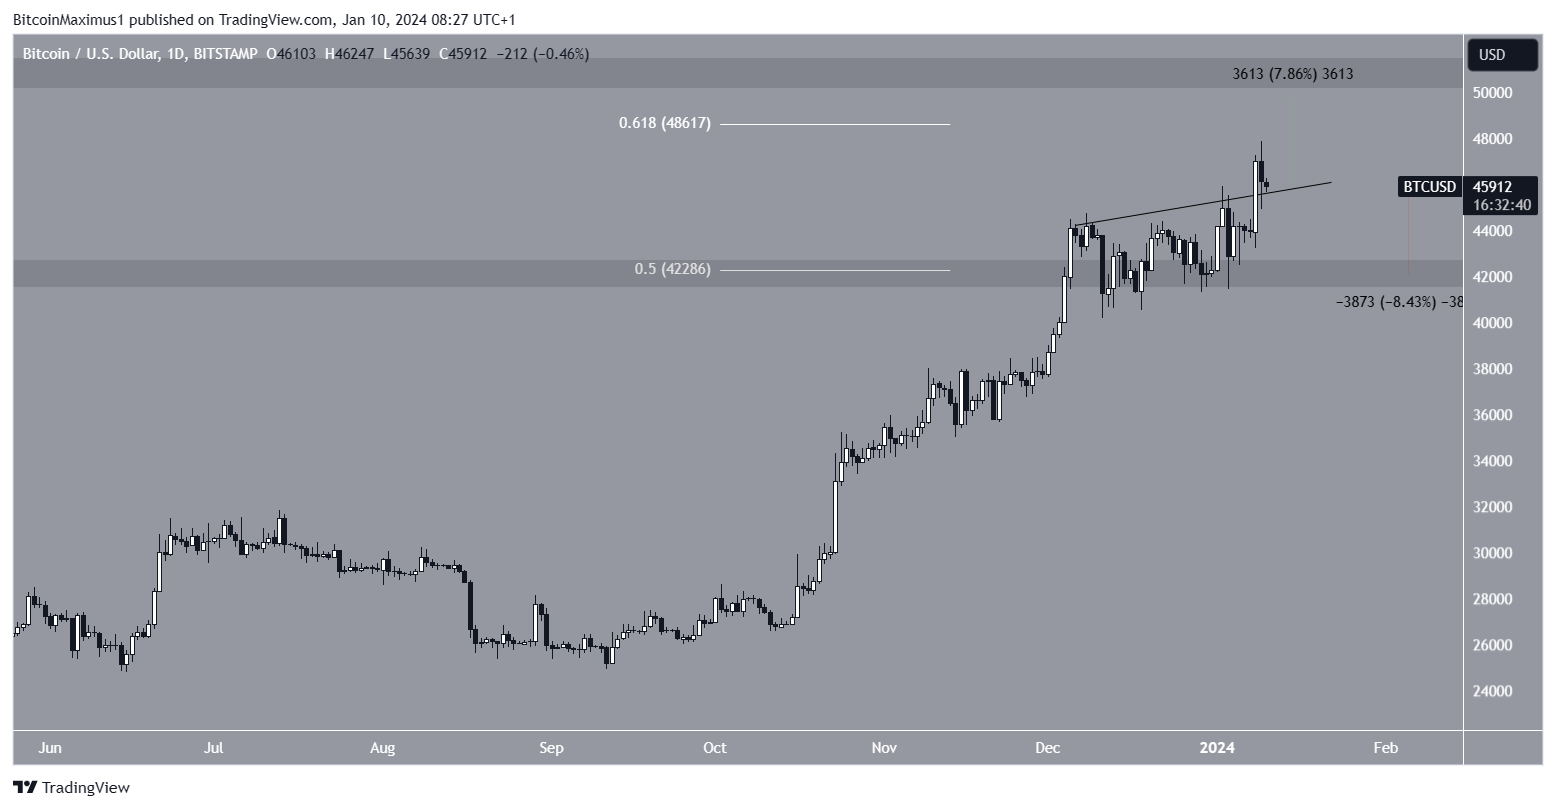
A successful bounce can lead to an 8% increase to the next resistance near $50,000, while a close below the trend line can trigger an 8% drop to the closest support at $42,000.
Read More: 9 Best Crypto Demo Accounts For Trading
KLAY Approaches Support
The KLAY price has fallen since December 2023, when it reached a high of $0.278. The downward movement culminated with a low of $0.153 yesterday. During this period, KLAY has created four consecutive weekly bearish candlesticks.
If the decrease continues, KLAY can return to its long-term support level at $0.140, a decrease of 25% from the current price.

Despite this bearish KLAY price prediction, a strong bounce at the current level can initiate a 33% increase to the descending resistance trend line at $0.240.
Read More: Best Upcoming Airdrops in 2023
For BeInCrypto‘s latest crypto market analysis, click here.
Disclaimer
In line with the Trust Project guidelines, this price analysis article is for informational purposes only and should not be considered financial or investment advice. BeInCrypto is committed to accurate, unbiased reporting, but market conditions are subject to change without notice. Always conduct your own research and consult with a professional before making any financial decisions. Please note that our Terms and Conditions, Privacy Policy, and Disclaimers have been updated.